1. Binding of DAPI to DNA. 2. The Jablonski diagram. 3. Long time fluorescence fading elucidates chromatin fractions differing in the degree of condensation 4. Short time fluorescence fading
exhibits information on binding mechanisms. 5. How many photons will excite one DAPI molecule in a low power flow cytometer? 6.
Few DAPI molecules are
surrounded by a predominance of binding sites. 7. A least comment will close this session.
Some conclusions are given beforehand:
1. AT repeats: DAPI binds to the minor groove with pronounced enhancement of fluorescence. GC repeats: DAPI binds intercalatively with narrow fluorescence such as the free dye. 3. Long time photo-bleaching over minutes exhibits a superposition of three exponentials and allows the quantitation of eu- and heterochromatin. 4. Short time fluorescence fading demonstrates three binding modes with a main decay time of 4 nanoseconds. 5. Excitation is poor in a low power (10 mWatt) flow cytometer and is confined to one photon per each DAPI . 6. Depending on the level of chromatin configuration the ratio of binding sites to DAPI ranges from 70 to 320 with a respective cubic spacing of binding sites from 13 to 8 nanometer. 7. Assuming a nucleus of 6 billion base pairs DNA (6pg and a GC/AT ratio of 1), roughly 6 million binding sites will be accessible for DAPI to bind, which is 1000 to 1. ..................................................
1. Binding of DAPI to DNA
Quantitative cytochemistry of cellular
DNA combined with cytometric technology is a sophisticated type of cytochemical
balance for estimating the amount (mass in picograms) of DNA in cells.
It will be shown that the dyes utilized
for this job are bound only to a very small portion (1% or lower) of total DNA,
and the fundamental concept of quantitative staining makes the assumption that
this small part relates to total DNA in a constant proportion. This is like
drawing conclusions from the weight of the hair coat to the whole body mass. Most protocols for fluorescent staining
of cellular DNA have been developed in the 70’s and 80’s of the last century.
Nowadays a lot of kits are available for this purpose and the actual laboratory
knowledge about the binding mechanisms increasingly fades away and ignorance
spreads out to some degree. Nevertheless, quantitative DNA cytochemistry
for providing a cell-by-cell estimate of the amount and organisation of nuclear
chromatin, is still a mystery. The following considerations are trying to elucidate some aspects of dye binding to double stranded DNA in cell nuclei.
DAPI (Dann et al. 1971) was chosen as a
representive molecule for this approach, but the results are in some respect
transferable to other stains.
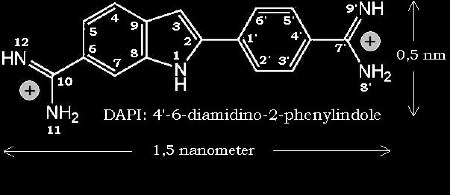
The molecular structure of DAPI is shown with Fig.1.
Fig. 1: Molecular structure of DAPI
DAPI is an
analogue of diarylamidine (berenyl). It exhibits no AT- binding specifity, but the
fluorescence is
markedly increased on binding to poly(d(A-T)) (Cavatorta et al. 1985).
On the
other hand, binding of DAPI to polynucleotides containing guanine and
cytosine - although taking place - do not result in an enhancement of fluorescence. Thus, the remarkable increase of DAPI fluorescence quantum yield is AT-selective and is nearly 25-fold compared to
the unbound dye.
The quantum yield of free DAPI is 3,5% and varies upon binding to DNA between 60% and 92% depending on chromatin structure.
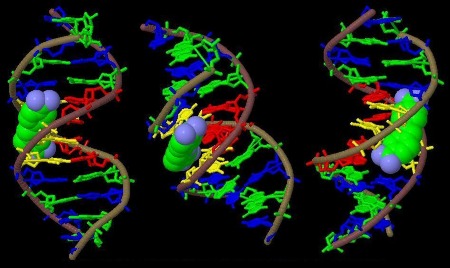
Fig.2a: A combined skeletal (Kendrew) and space filling (Corey-Pauling) model of B-DNA and DAPI bound to the minor groove. For more info klick here.
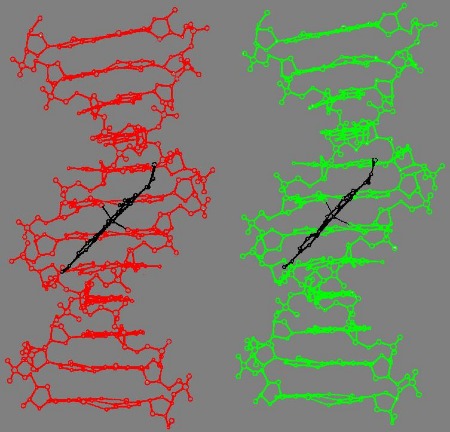
Fig.2b: Stereo image of the Larsen model of DAPI bound to the B-DNA decanucleotidyl C-G-C-G-A-A-T-T-C-G-C-G (slightly modified according to Larsen et al. 1989)
An excellent review on "DAPI: a DNA-specific fluorescent probe" is given by Jan Kapuściński (1995).
In their
recent paper Banerjee and Pal (2008) found that both types of bonding may
occur:
minor groove binding to AT repeats with pronounced enhancement of fluorescence,
whereas GC repeats allow intercalative bonding with narrow fluorescence such
as the free dye.
In addition, as reported for 33258 Hoechst (Latt and Wholleb 1975) which binds in a
similar fashion to DNA (Pjura et al. 1987, Portugal and Waring 1988, Haq et al. 1997, Bostock-Smith and Searle 1999) chromosomal proteins modify the capacity of DNA to
associate with DAPI. They may block at least half of the binding sites which
are available in native DNA (Darzynkiewicz et al. 1984, Rundquist 1993). The geometry
and electrostatic outfit of the minor groove may vary due to local factors from one
base pair to the next (Larsen et al. 1989). Thus, upon the sensitivity to sequence makeup and unpredictable
interaction of proteins, it is rather insecure to calculate the accurate number
of binding sites. It might be much smaller than any computation will point out.
The formation of DNA-DAPI complexes and subsequent excitation of
fluorescence yield a couple of pro- cesses with their corresponding rate
constants. The rate constant is the formation change per time (commonly seconds). The reziprocal rate constant is the transition time.
1. Formation of the DNA-dye complex and its
reversed dissociation with the corresponding reaction rates. 2. After irradiation the complex is transferred
into an excited state and besides fluorescence various processes of quenching may occur, each linked to its own rate constant. 3. Photolysis and other disintegrating
reactions may happen.
Finally up to eleven reaction constants
may play a role in processing the energy of each absorbed photon (Watson
1991).
If all rate constants are stable in itself,
than the outcome of fluorescence is a constant portion of the sum of all processes. In living cells and those which are well preserved by cross-linking fixatives
(glutaraldehyde, formalin and a couple of others which are well established in histology and cytology, Romeis 1968) cell-to-cell differences in these rate
constants are to be ex- pected, depending on the organisational level and the functional
activity of the chromatin (Ringerts 1969). Despite constancy in DNA content the
DAPI fluorescence may vary and the coefficient of variation in DAPI cytometry
of cells fixed with aldehydes is 10% and worse (Vinogradov 1995). The crude fixation with ethanol (dehydration) may cut those slight deviations. As a consequence, fixation with methanolic or
ethanolic solutions is commonly in use for DNA measurements in flow. ..................................................
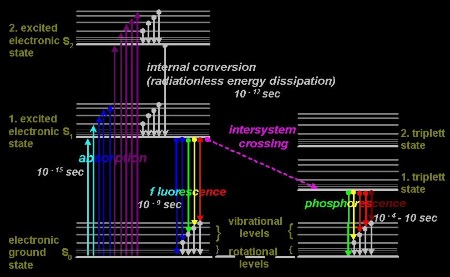
2. The Jablonski diagram
The
interaction between light and matter is commonly illustrated with a diagram,
mostly exerted itself,
which has been invented by Jablonski (1935), fig.3a, an ukrainian physicist and the
father of fluorescence spectroscopy. It is given in fig.3b.
Fig.3a: Alexander
Jablonski (1898-1980) was born in Voskresenovka, Ukraine. Among
other accomplishments, he defined the term "anisotropy”, describing
the polarized fluorescence from solutions.
Fig.3B:
A type of Jablonski diagram
upon the energy scheme of fluorophores
Basically a
three-step process results in fluorescence: 1. a photon
is absorbed within 10^-15 sec and raises an electron into a certain
vibrational level of a higher electronic state
which leads to an excited state of the
fluorophore, 2. during
internal conversion within 10^-12 sec the electron drops down to the
lowest level of the first excited electronic state
and the corresponding energy is mainly dissipated into heat. 3. A return
of the electron within some 10^-9 sec to one of the vibrational
levels of the ground state leads to emission of a
photon.
Due to energy
dissipation during internal relaxation of the fluorophore after being excited
the energy of the emitted photon is lower than that of the absorbed one.
Consequently, the wavelength of absorbed photons is shorter than of the emitted
ones. The fluorescence color is shifted into the red compared with the spectrum
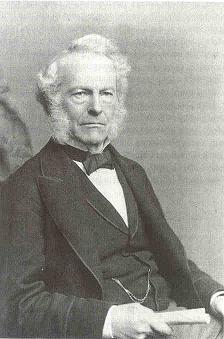
of the absorbed light. This fact was first (1852) observed by Stokes (fig.4), a
Lucasian Professor at Cambridge and is called the “Stokes’ shift”.
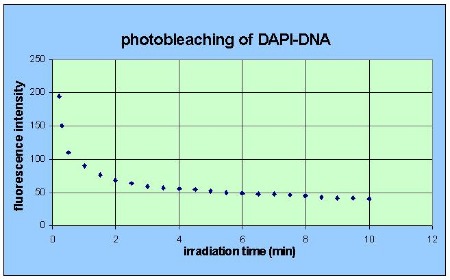
3. Long time fluorescence fading elucidates chromatin fractions differing in the degree of condensation
As for any other fluorescent dye the
fluorescence of DAPI bound to cellular DNA exhibits pronounced photo-bleaching
under prolonged irradiation as shown in fig. 5.
The rate of
photo-bleaching is charac- teristic for each substrate-dye complex. A mixture of
fluorescent complexes differing in their macro- molecular organisation may fade
at various rates which are superimposed.
Fig.5: Photo-decomposition
of DAPI
bound to nuclear DNA
of diploid
liver cells of the mouse under
continuous excitation over minutes.
The decay curve of DNA-DAPI is a superposition
of three exponentials with different time constants indicating that three types
of divergently structured binding sites are present. Studies on the
photo- decomposition of Feulgen stained nuclei (Benwitz 1965, Haag et al. 1971)
have demonstrated, that isopyknotic (euchromatin), heteropyknotic (heterochromatin) chromatin and a third intermediate chromatin fraction (found
by Frenster et al. 1963, in biochemical studies) are differently sensitive to
photo-bleaching. Haag et al. (1971) applied photo-decomposition
for the determination of eu- versus heterochromatin in normal and tumor cells.
Photo-bleaching does not occur at all in
the first microseconds of excitation (Bergquist 1973, Rost 1991) under moderate illumination intsensity (50 mWatt and less) and the time
constants describing the subsequent fading are rather high.
Therefore photo-bleaching has no
significant influence on flow cytometric analyses! But microscopic studies
have to face these circumstances immediately! ..................................................
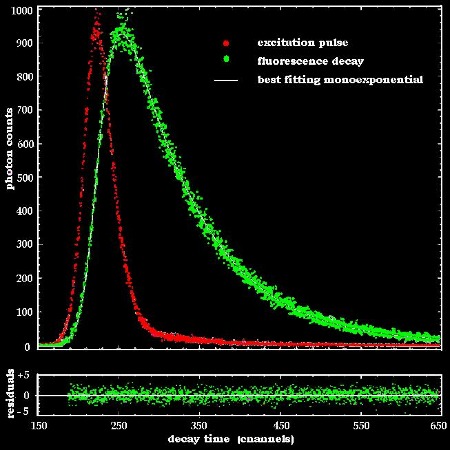
4. Short time fluorescence fading
exhibits information on binding mechanisms
After irradiation the lifetime of the excited
states of any fluorochrome is about some nanoseconds. A typical fluorescence
decay measurement is shown in fig.6.
Fig.6:
Plot of the excitation
pulse and
time-resolved
fluorescence
of R6G exhibiting
a single
exponential
decay.
The white
curve indicates the best
fit with evenly
distributed residuals.
Einstein’s
(1917) formulations of the transition probabilities for atomic absorption and
spontaneous emission of a photon has been modified by Perrin (1926), Lewis and
Kasha (1945) and finally by Strickler and Berg (1962) for absorbing and
fluorescing systems (composite molecules) in solution for compounds with quite
high quantum yield, preferably nearly equal to 1, resulting in the expression
including the following terms in particular:
Tfl =
the fluorescence decay time (life time of the excited state) in seconds;
n = refractive index of the medium; ε = wavelength dependent decadic molar extinction coefficient in 1/(mol * cm); Ú fl = wavenumber (= reziprocal wavelength (in centimeter)) of the fluorescence maximum in 1/cm; Ú abs = wavenumber of the absorption maximum.
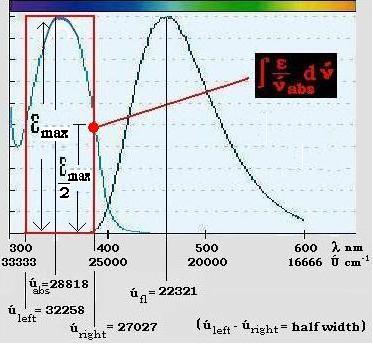
Fig.7 gives an impression, how the integral term is to be determined.
With the following
values we calculate the fluorescence decay time of DAPI bound to in situ DNA:
Fig.7: Calculation of the fluorescence life time of DAPI bound to DNA in situ. Illustration for extracting the spectral integral out of the given corrected spectra of absorption and emission.
Experimentally, the fluorescence decay
of DAPI bound to DNA exhibits a triple exponential decay function
(fig.8). The life times are 3,9 nsec, 1,8 nsec and 0,1 nsec representing percentages of the total fluorescence of
85%, 12% and 3% (Cavatorta et al.1985, Barcellona and Gratton 1989 + 1990). The dominant 3,9 nsec is in excellent agreement with the theoretical value of 4 nsec.
Fig.8: Fluorescence
lifetime data of DAPI-DNA after convolution analysis. Plots of
the remaining residuals after autocorrelation. Decay
curves have been fitted with the following functions: (top)
single
exponential decay, (middle) double exponential
decay, (bottom) triple exponential decay delivering the best fit. (Cavatorta et al.1985)
Neglecting the 3%-portion, these results
indicate a two order binding reaction of DAPI to DNA with a dominant first
order part of 85%. In all these experiments the phosphate to
dye ratio (P/D) was rather high (around 150 and more). At lower ratios very
close binding of DAPI to previously bound DAPI molecules will shift the
fluorescence maximum from the blue (460 nm) into the green (540nm). This new
band is caused by weak electro- static interaction between these proximate DAPI
molecules.
Based on these facts the
staining concen- trations of DAPI in cytometry should be 1 to 10
µmol and this is the fact in most protocols. ..................................................
5. How many photons will excite one DAPI molecule in a low power flow cytometer
The effective cross-section (σ) of light absorption of a DAPI molecule can be calculated from the decadic molar extinction coefficient at maximal absorption (van den Engh and Farmer 1992, Lakowicz 2006, pages 58-59).
The relation is the following: σ = ln(10) •10^3 •ε / N (cm^2)
where σis the cross-section, ε is the decadic molar extinction coefficient, N is Avogadro's number, the number of molecules in one mol;
ln(1o) corrects for the natural logarithm due to the fact that ε is
commonly given in decadic logarithms; whereas 10^3 corrects for solvent
concentrations given in moles per liter (10^3 cubic centimeter). With the following values ε = 23600 per mol and cm (Kapuściński and Skoczylas 1978) N = 6,2 • 10^23 we get σ = 2,3• 10^3 • 2,3 • 10^4 / 6,2 • 10^23
We now will try to evaluate the number of photons
ready to excite one molecule of DAPI with its small effective cross-section of
nearly 1 square Ångström.
The energy of a UV photon at wavelength λ=360 nanometer (corresponding frequency ν=0,83*10^15 / sec) is E=h*ν with h=6,625*10^-34 Joulesec as Planck's constant. So we get E=5,5*10^-19 Joule as the quantum of energy of said UV photon. So a laser radiating with 10*^-2 Watts delivers 1/5,5*10^-19=1,8*10^16 photons per second. In a common flow cytometer this laser is focussed down to a spot for excitation of roughly about 20 µm in diameter with an area a= 314*10^6 square nanometer.
This equals to Z=1,8*10^16 / 314*10^6 = 5,73*10^7
photons per square nanometer and second and leads to
N(σ)=5,73*10^7 * 8,8*10^-3 = 5*10^5
as the reservoir of photons for the excitation of one DAPI molecule per second.
The time of intersection in a common flow system is about a few microseconds. If we assume t(exc)=2 microseconds as the excitation time we are getting only
N(exc)= 5*10^5 * 2*10^-6 = 1
photon to interact with DAPI, which is a remarkable low number.
All the assumptions we have made may be tuneable.
But nevertheless the order of magnitude of the number of photons which might hit and excite each bound DAPI molecule will be low in such a way that low laser power will not be sufficient enough for suitable resolution in flow cytometric sorting of chromsomes and other objects with low DNA content.
This is the basic reason why high power lasers are needed for chromosome sorting. ..................................................
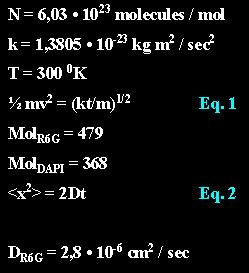
For the following considerations we will put together some
values and formulas which we do need
later:
Molecular weight of Rhodamine 6G.......................................:
Molecular weight of DAPI.....................................................:
mean square diffusion path..................................................: (Feynman et al. 1970 and Berg 1993)
diffusion coefficient of R6G..................................................: (Rigler et al. 1993)
Additional considerations:
Liter to cubic-nanometer:
Given a solution of molarity one (1 mol) than one molecule of the solute will populate a volume of
One molecule in a solution of molarity X will occupy a volume of: ..................................................
6. Few DAPI molecules are
surrounded by a predominance of binding sites
The routine molarity of DAPI solutions is about 1 to 10 µmol. The author himself did use 8 µm; so let us take this value - the following calculations should be adapted to differing molarities, respectively.
A DAPI solution of 8 µmol contains the following number of molecules in a liter:
With equation 4 we calculate the average volume which is populated by one DAPI molecule in space:
This results in an average distance between adjacent DAPI molecules:
This leads to a maximal distance of 30 nm between a binding site and surrounding dye molecules. ..................................................
How many DAPI molecules are in the volume of a human diploid cell nucleus?
The amount of DNA (in pg) in a cell nucleus relates to its volume (in cubic-µm) according to the following equation: (Baetcke
et al. 1967 and Nagl 1976)
we convert into
inserting DNA=6 pg we end up with
which finally leads to a nuclear diameter of
This value is in good agreement with calibrated images published by Stöhr et. al. 1969.
Taking equations 3,4 and 5 the number of DAPI molecules present in a volume of a cell nucleus lodging 6 pg DNA is:
A small assembly of 350 thousand DAPI molecules should take over the function to label the huge amount of 6 billion base pairs quantitatively, which is a ratio of 0,00006 to 1. ..................................................
The ratio of binding sites to DAPI molecules
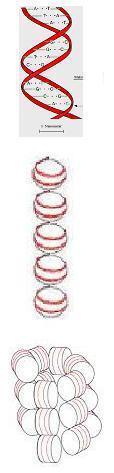
Chromatin, the holder of DAPI binding sites, presents itself in different configurations: helical, nucleo- somal and solenoidal (Voet and Voet 1992).
The double helix has cylindrical dimensions of 2 nm x 3,4 nm and 10 base pairs perform one turn.
The fundamental components of nucleosomal DNA strings are globular elements with 10 nm in diameter each of it comprising 200 base pairs in 524 cubic-nm.
6 nucleosomes assemble 1 solenoid: 30 nm broad and 10 nm high. One solenoid has a volume of 9000 cubic-nm including 1200 base pairs.
Assuming a GC/AT-ratio of unity and a random distribution of
base pairs than the probability of quadrupletts with identical pairs is about 0,4%.
With 6 billion base pairs in a 6 pg cell nucleus
we are dealing with the following relations:
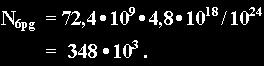
Helical level: 0,024 billion = 24 million AT base quadrupletts in a volume of 72,4 cubic-µm (eq.6) lodging about 348 thousand molecules of DAPI end up in the ratio of binding sites / DAPI's
Solenoidal level: 1200 base pairs per solenoid yield 5 AT quadrupletts in 9 thousand Cubic-nm. Divided by the mean dye free space around each DAPI molecule of 210 thousand Cubic-nm we obtain
Nucleosomal level: 200 base pairs implying 0,8 AT quadrupletts in 523 Cubic-nm deliver the relation
In conclusion, depending on the level of chromatin condensation the ratio of binding sites / DAPI ranges from 70 to 320, with a respective cubic spacing of the binding sites from 13 to 8 nm.
These small values of spacial separation are comparable to the critical distance
of fluorescein and other fluorescent organic molecules (Wawilow 1925, Förster 1948, Bojarski 1961)
below which the fluorescence intensity and
fluorescence polarisation declines to zero. Smaller distances, at higher concentrations, lead to
the destruction of excitation energy due to Förster resonance energy trans- fer along
the chain of adjacent fluorophores. Saturation of all these binding sites would end up in a significant decline of fluoresence intensity of DAPI and cytometric investigations would be a risky or even unprofitable undertaking.
By keeping the dye concentration low enough only a portion of bindings sites will bepopulated by the dye and the majority of sites will be unstained. On the other hand, enough binding sites will be blocked by proteinand willtherefore be unaccessible for the dye.
How does this balancing out of quantitative staining work?
Magic words in this context are diffusion and random walk in biology and they will be the issue of the next session. ..................................................
7. With a least comment we will close this session:
As
already calculated (eq. 5) we have
molecules
of DAPI in one ml and 0,024 billion as the theoretical
number (on the helical level) of binding sites in a 6 pg cell nucleus.
This leads
to 20 million
cells in one
ml offering the same number of binding sites as molecules of DAPI
are present in this volume of one ml. If one does
this and tries to separate the stained cells from the remaining solution by using a 0,22 µm filter unit (for sterilizing
aqueous solutions) then a cell free solution with unbound DAPI is ready to be
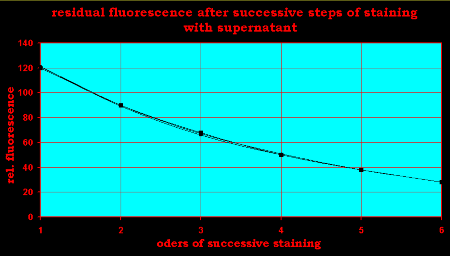
applied for a second staining step of cells. This procedure can be repeated
several times. After each step the nuclear fluorescence deminishes according to
the decrease of DAPI molecules bound in the preceding step. Figure 9 shows the
results.
Fig.9: Decay of nuclear fluorescence after successive staining with the remaining and deminishing dye concentration
During 5 repeats of this dilution process the nuclear fluorescence
decreases from step to step by 25%. Therefore, in
the very beginning, the number of binding sites occupied by DAPI was only a quarter of the value
calculated. Let us assume a nucleus of 6 billion base pairs DNA (6pg and a GC/AT ratio of 1), then roughly a quarter of 24 = 6 million binding sites are accessible for DAPI in said nucleus, which is 1000 to 1.
Is'nt it a marvel to draw conclusions on the whole by measuring only one tenth of a percent.
Basically, DAPI does
not bind in a covalent fashion to DNA rather than by electrostatic forces. So the
permanent onset of entropy gives rise to perpetual release of DAPI molecules bound
to their sites. Other dye molecules in the neighbourhood may replenish them
again. A decreasing number of DAPI molecules consequently leads to a deminishing colonization of binding sites and a loss in overall cellular fluorescence.
Therefore we have been dealing with two questions in understanding the cytometrics of nuclear DNA with DAPI:
1. How large is the average life time (or dissociation rate) of DAPI bound to nuclear DNA?
2. How long
does it take that a DAPI molecule – maximally 30 nm apart – will
reach these deserted sites by random thermal migration to make sure that during the measuring time the number of sites populated by DAPI is rather constant?
The answer will be
discussed in the section on diffusion.


 With the following
values we calculate the fluorescence decay time of DAPI bound to in situ DNA:
With the following
values we calculate the fluorescence decay time of DAPI bound to in situ DNA: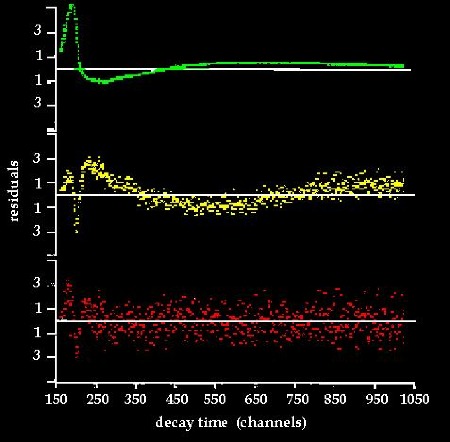
 Avogadro' number..............................................................:
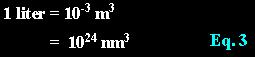 Liter to cubic-nanometer:
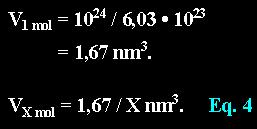 Given a solution of molarity one (1 mol) than one molecule of the solute will populate a volume of
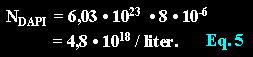 A DAPI solution of 8 µmol contains the following number of molecules in a liter:
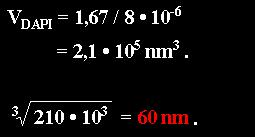 With equation 4 we calculate the average volume which is populated by one DAPI molecule in space:
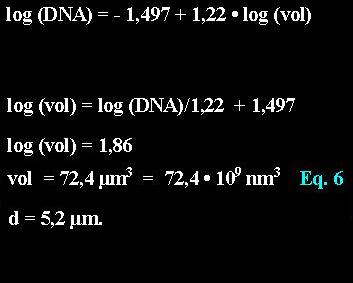 The amount of DNA (in pg) in a cell nucleus